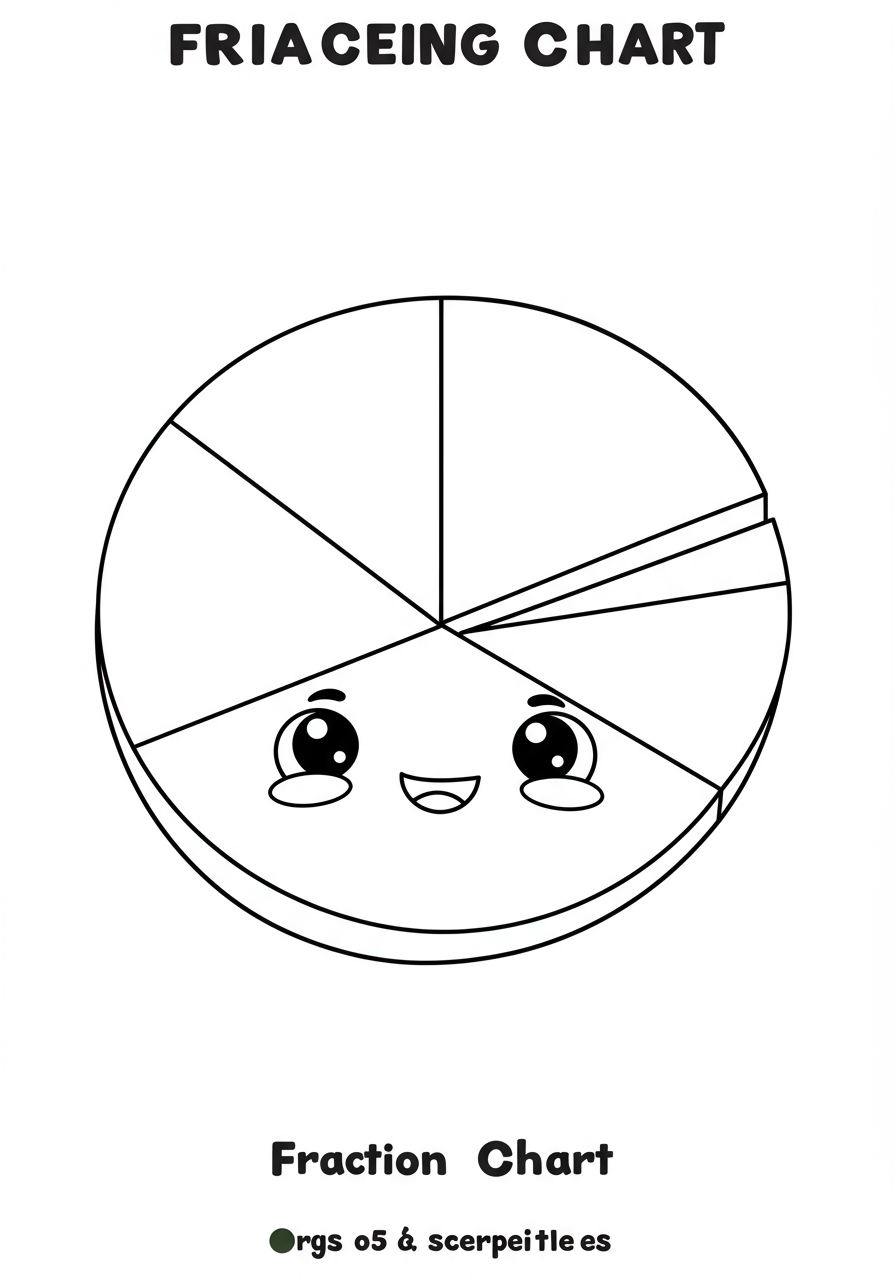
Fraction Pie Chart Free Printable Coloring Page
Welcome, young artists and mathematicians, to our super fun Fraction Pie Chart coloring adventure! Have you ever shared a pizza with friends or cut a cake into slices? Then you've already been working with fractions! Fractions are a way we describe parts of a whole thing. A pie chart is a clever circular picture that helps us see these parts really clearly. It’s like looking at a delicious pie that’s been perfectly sliced up! This free printable coloring page is designed to make learning about fractions as easy and enjoyable as possible. Get ready to grab your crayons and discover how different parts fit together to make a whole!
About This Coloring Page
This delightful coloring page features a friendly, smiling fraction pie chart right in the center, waiting for your creative touch! The pie chart is clearly divided into different sections, illustrating common fractions like halves, quarters, and maybe even thirds. Each section is outlined boldly, making it easy for little hands to stay within the lines. Around the main pie chart, you might find some playful elements like stars, happy little numbers, or even some yummy-looking fruit slices, all designed to make the learning experience bright and engaging. It’s a perfect visual aid to help children understand the concept of a "whole" being made up of "parts."
Coloring Tips
Now for the fun part – coloring! To make this fraction pie chart really stand out and help with learning, try using a different color for each section of the pie. For example, if one section shows "1/2," you could color it bright red, and then color the other "1/2" a cool blue. Or, if you have sections for "1/4," you could use four different vibrant colors! Don't forget to color the background and any surrounding details like stars or numbers to make your page extra special. You can even try labeling the fractions in each section after you’ve colored them to reinforce what you've learned. Use crayons, colored pencils, or markers – whatever you love best!
Fun Facts
Did you know that "fraction" comes from the Latin word "fractus," which means "broken"? That's because a fraction shows parts of something that's been broken or divided. A pie chart is sometimes called a circle graph because it's a circle divided into sectors, like slices of pie. They are super useful for showing how a whole amount is divided up, like how much of your day is spent playing, sleeping, or learning! Governments, scientists, and even businesses use pie charts all the time to quickly understand data. So, by coloring this page, you’re not just having fun, you’re also practicing a very important math skill that people use every single day in the real world!